Here’s an interesting way to help understand the flow of energy in a rooftop solar system. Who knew that Venn diagrams and simple algebra could help explain solar?
Richard Keech
2021-01-26
Solar flows
First lets get some clarity about the different flows of energy in a home solar system. And let’s clear up the confusing terminology. Solar is best understood as involving four different flows of energy: generation, consumption, import, and export, as shown in the diagram below.
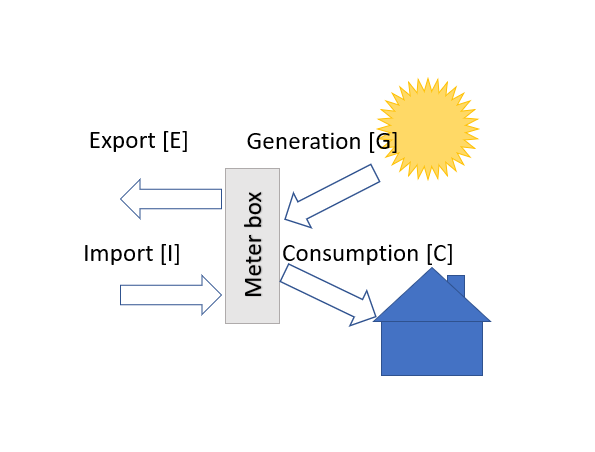
Power and energy. Each flow can be understood as either instantaneous power, or as an amount of energy over a set period (often one year);
Meter box. The meter box is a point of reference though which all energy flows;
Consumption first. Generation satisfies consumption first, and any left over contributes to export;
Net metering. The measurement of the the exported energy in this way is called ‘net metering’, i.e. the meter measures net generation, after self consumption;
Self consumption. The use of solar generation in the home is called self consumption. Let’s call that amount of energy self consumed as ‘S’. S is always less than or equal to G;
Self-consumption rate. It’s useful to reckon self consumption as a proportion of generation – (SCR), i.e SCR = S/G. As a general rule, the higher the better;
Export and generation are different. Export is always going to be less than generation. There may be confusion in terminology. From the electricity company’s point of view, they only know about exported energy, but they usually refer to it as generation. If you see an amount called ‘generation’ on an electricity account, know that it’s actually export, not real generation;
Import or Export. The flow in and out of the premises is on one (single- or three-phase) connection, so at any moment there is only either export or import flow;
Net-energy positive. If a home imports more energy than it exports, over a set period (usually a year) then we say it’s net-energy positive.
Consumption not measured directly. Normally export and import values are measured by the electricity meter, and generation values are from the solar inverter. Consumption then needs to be calculated, as shown below.
Overlapping consumption and generation
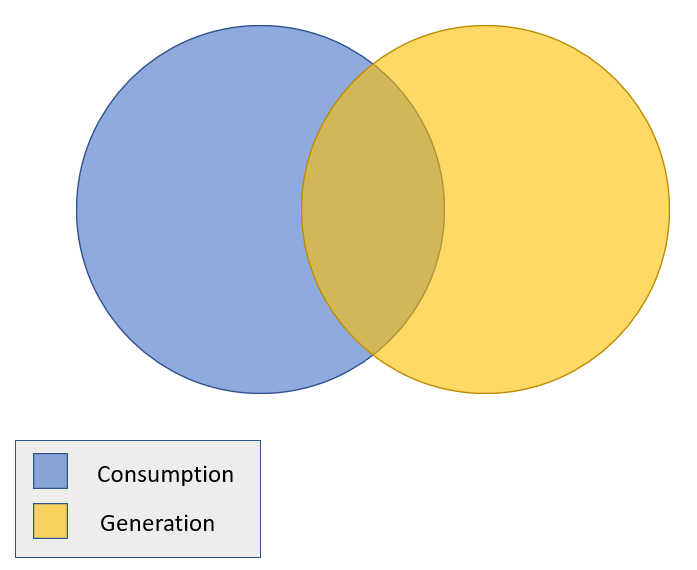
It’s useful to think of amounts of energy in each of these flows as being a set of kilowatt hours. In the case of consumption and generation, those sets overlap. The amount they overlap is the self consumption. So the Venn diagram above can help make sense of this.
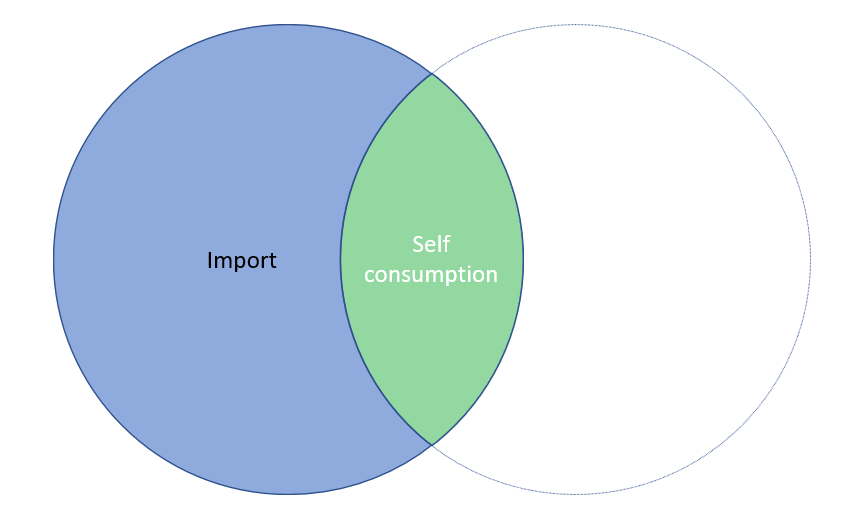
If self consumption is the overlap, then the rest of the consumption is the import amount. So the self consumption plus the import is the consumption, C = I + S, or S = C – I
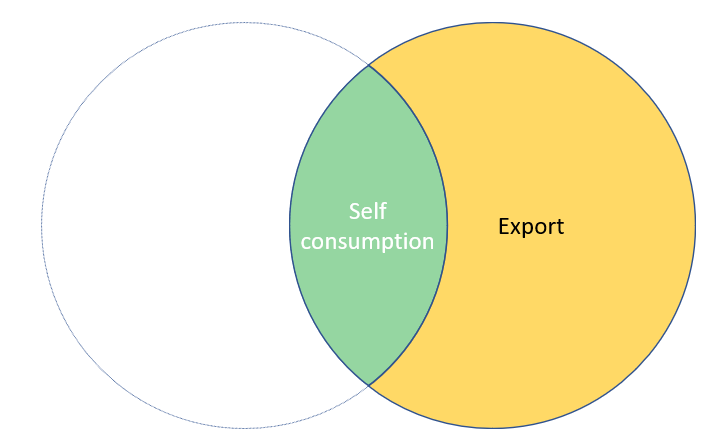
Likewise on the other side, self consumption plus export equals generation. S + E = G, or S = G – E
The meter box equation
With these simple relationships between the different flows, we can combine them:
S = G – E = C – I
This gives us a way to figure out consumption, given the known values of generation, import and export.
C = G – E + I
Example
To use this in the real world, here’s an example. I measure the energy at my home at the start of each year. I can measure generation directly from the readings on my solar inverters. I can measure import and export as separate ‘registers’ on my meter. In my case register 3 holds the the current value of total imported energy, and register 13 holds exported energy. Comparing the current value to the previous value gets you the values of export and import for the year.
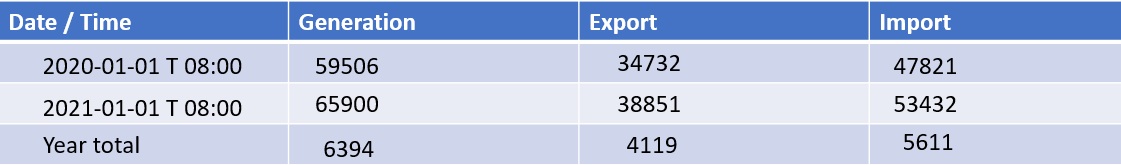
So, I can apply the measured values of G, E and I, to calculate C. In my case my total premises consumption is 6394 – 4119 + 5611 = 7886 kWh for calendar year 2020. For me that amount is the combined consumption of the home plus my electric car.
Buy, sell, match
Sometimes you see an alternative terminology applied when considering the real time energy flows. If generation exceeds consumption at a particular time, then sometimes the export is referred to as ‘sell’, i.e. sold energy, and the self consumption is referred to as ‘match’ i.e. the amount of generation that matches the consumption. Then at times when generation is less than consumption, we have ‘match’ and ‘buy’, i.e. the generation ‘matches’ consumption, and the balance of consumption is the ‘buy’ part.
Next
In the next part I’ll build on the use of Venn diagrams to represent different solar scenarios.