By Richard Keech
2019-01-18
Here’s a quick look at how I’ve transformed my home to zero bills. Since the beginning of the transition, at the time of writing I’ve saved nearly $49,000 in energy. I expect to have paid back my investment in solar and efficiency by the end of 2019.
Despite using much less energy, it’s also worth mentioning that the home is also much more comfortable than it was previously, thanks to the fundamental improvements to the thermal envelope.
Energy consumption reduced to less than energy generation
Starting point
2006 was the last year before making significant improvements. In 2006 my home consumed about 80GJ of mains energy (gas and electricity), which made it roughly comparable with homes in my suburb.
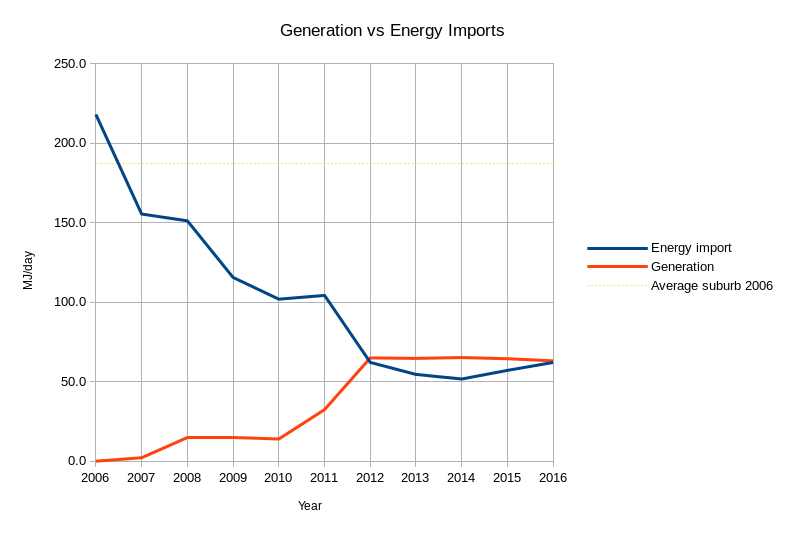
Net energy positive
My home now generates more energy than I consume (excluding consideration of my EV). This was achieved over about seven years by retrofitting my suburban Melbourne home to be much more efficient, and by adding solar PV (and then adding a lot more).
So by generating more than I consume, I’m net energy positive.
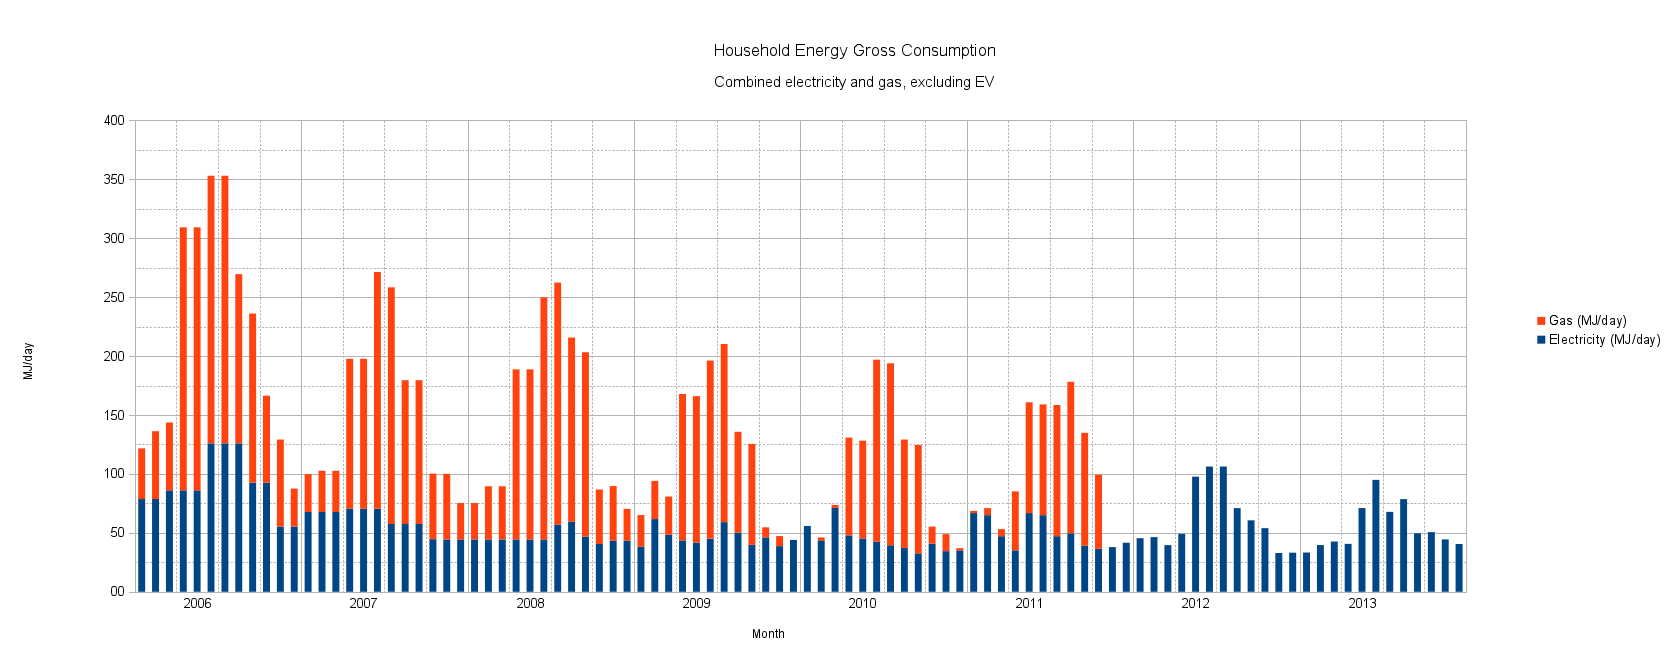
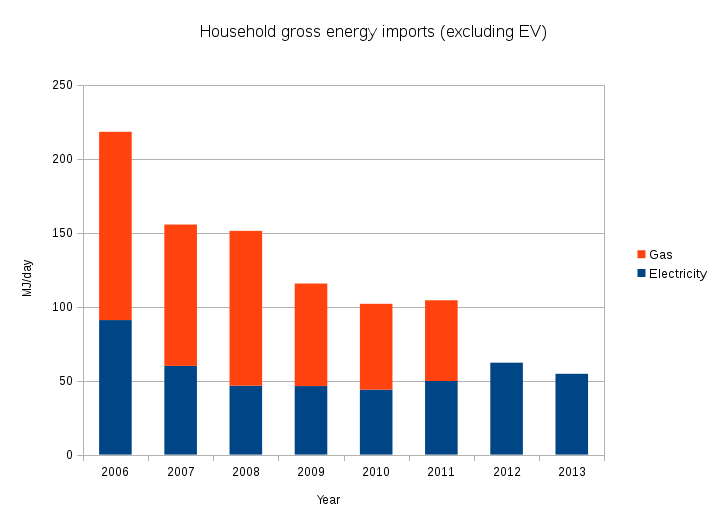
Getting off gas
A big part of being efficient and environmentally responsible was ditching gas. I previously used gas for heating, hot water and cooking. The monthly energy use (gas and electricity) over the period 2006 – 2013 is shown below. This is gross consumption of the home only, i.e. solar generation and EV consumption are additional. It clear on this chart how gas was disconnected in October 2011. Even though this led to a subsequent increase in electricity use, the overall trend continued downwards.
Retrofit improvements
Over the course of 2007 to 2013 I made a host of improvements to my home. Here’s the basic outline:
- 2007: Roof insulation upgrade
- 2007: 1.3kW of solar PV
- 2008: sub-floor insulation
- 2008: replacement fridge
- 2008: replacement cooktop (induction in place of gas)
- 2009: professional draught proofing
- 2009: solar/heat-pump hybrid hot-water system (in place of gas)
- 2010: secondary glazing all windows
- 2010: standby power management
- 2011: LED lighting upgrade throughout
- 2011: TV upgrade (plasma replaced with LED)
- 2011: additional 3.7kW of solar PV
- 2011: gas disconnected
- 2012: split-system installation in seven rooms for heating and cooling
- 2013: walls insulated
During this time (and still) the occupancy of the house has remained the same, i.e. two adults and two children.
Solar
I’m lucky enough to now have 5kW of solar PV capacity, all with the Victorian premium feed-in tariff. This means I’m generating about 6600kWh/annum, of which about 4700kWh/annum (~71%) is exported to the grid.
It’s perhaps worth noting that someone attempting a similar transition today would not get the very high feed-in tariff I receive. But on the other hand the up-front cost for solar for me was very much higher than would be the case for someone in 2019.
Result
Since 2013 not much extra has changed. We’re now consuming about 20GJ (5500kWh) of mains energy per annum, a 75% reduction. The remaining 25% is fully offset by solar. We’ve been net energy positive and enjoyed negative energy bills since 2012. In 2018 my net energy account was a credit for $1221.
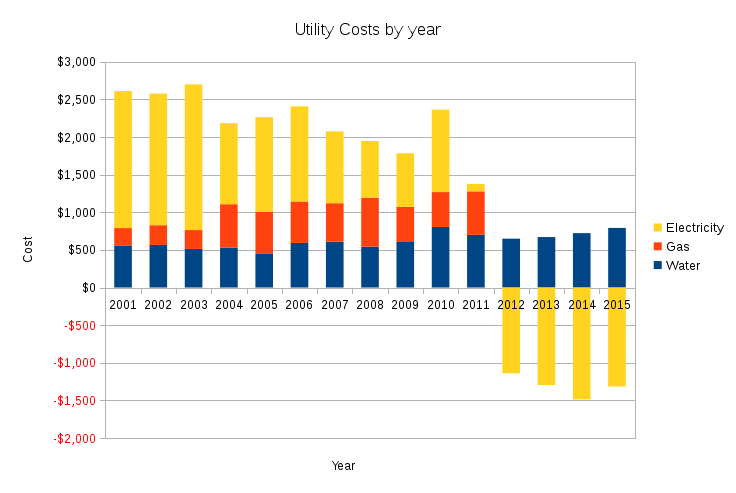
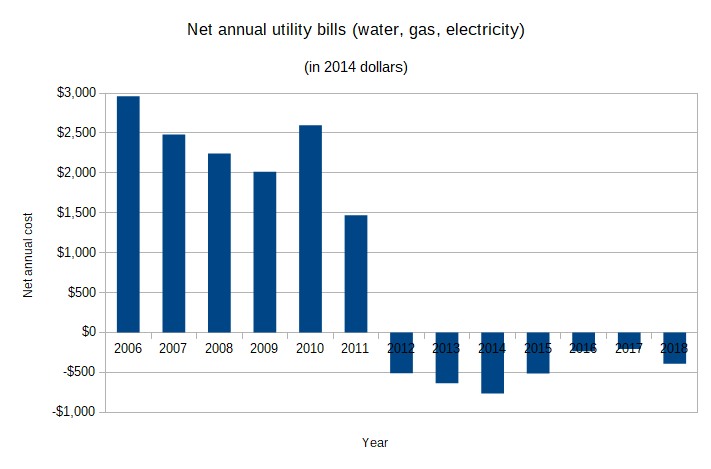
Avoided energy cost
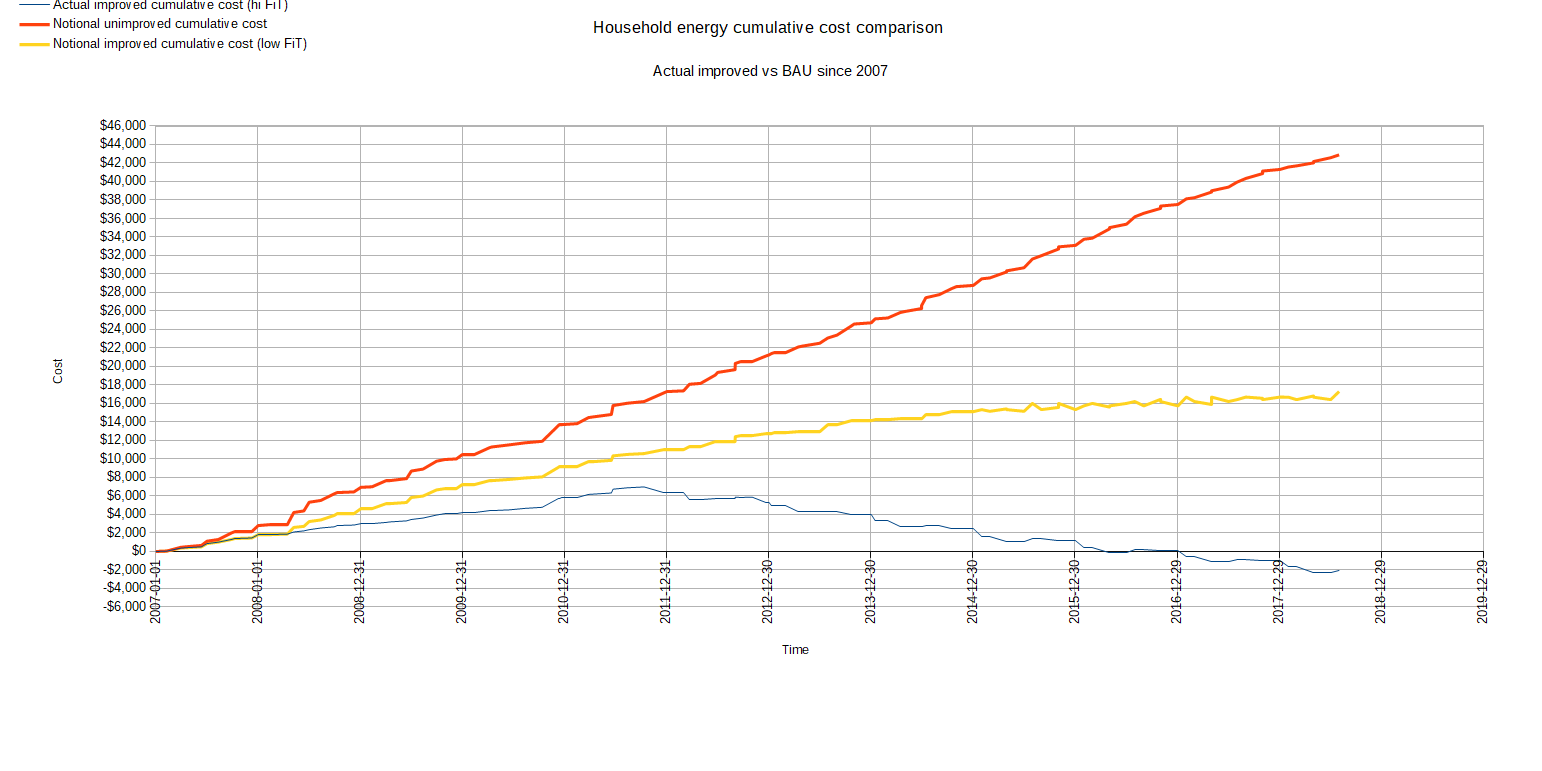
Since January 2007 till end of 2018, the total avoided energy cost is $48,850. This is calculated by comparing hypothetical business-as-usual (BaU) cumulative energy spend (the red line on the chart below) with actual energy spend.
Note that the yellow line in the chart shows what the situation would be if I received the standard feed-in tariff instead of the premium feed-in tariff. This illustrates that the savings would still be considerable even without the premium feed-in tariff.
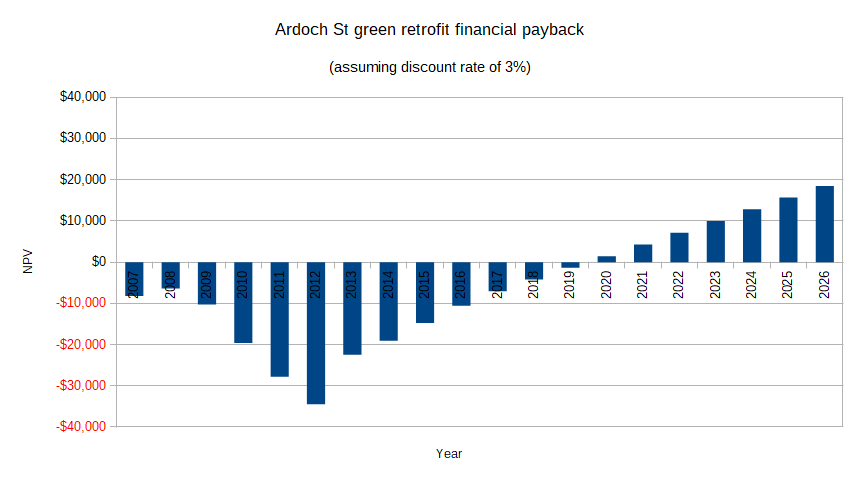
Net present value
Looking at the overall effort over time through a financial lens, I expect to achieve financial payback in 2019. The NPV of this is shown below.
Further reading
Sustainability Victoria’s estimates for running costs in many difference scenarios here.